How to calculate automation ROI without counting imaginary savings
Calculate automation ROI with a complete worked example, separate cash and capacity measures, ownership costs, sensitivity checks, and a testable pilot plan.
Automation ROI becomes misleading when every minute removed from a task is counted as money returned to the bank. Recovered staff capacity can be valuable, but it is different from reduced spending. A useful business case shows cash effects, capacity effects, and possible revenue effects separately, then explains the assumptions connecting them.
Start with a measured task and a decision you actually face. You might be choosing whether to automate document routing, deliver digital resources automatically, or reduce repetitive order checks. The calculation should help you decide whether to pilot, change the design, or stop. It should not exist simply to justify software already selected.
Define the outcome before the calculation
Write the operating outcome in plain language. “Send the correct released resource after a verified paid order, with a recovery route for failed delivery” is more useful than “automate ecommerce.” The specific outcome tells you which work, errors, and ongoing responsibilities belong in the model.
Define a comparison: the current process, a simpler manual redesign, and the proposed automation. Sometimes removing an unnecessary approval or improving a document gives most of the benefit without adding operating complexity. Compare the proposed system with the best practical alternative, not only with today’s most frustrating version.
IBM’s overview of business process automation connects automation with repeated business work and process design. That is a useful starting boundary, but the numbers below must come from your workload and observed pilot results rather than general vendor benefit claims.
The process mapping guide can help define the exact beginning and finish of the work you intend to measure.
Measure a baseline that includes hidden work
Count eligible cases over a representative period. Record normal handling time, rework, exceptions, and required review. Separate time actively spent from elapsed waiting. A customer might wait two days for a task that consumes six minutes of staff work; eliminating that wait does not recover two days of labor.
Use observations across more than one person and case type where the workload permits. Record when the sample was taken and what it excludes. A quiet week or a training period can distort a projection if you treat it as permanently typical.
Keep the baseline simple enough to repeat. A small log can show the case reference, work category, active minutes, correction minutes, and exceptional circumstances. Avoid copying unnecessary customer data into a measurement file. You need evidence about the process, not an additional archive of private records.
If the work is highly variable, use separate categories rather than one misleading average. Standard requests, incomplete requests, and unusual cases may have different volumes and handling costs. An automation that handles the standard category should not receive credit for eliminating work in categories it cannot manage.
Separate three kinds of benefit
Cash savings occur when spending actually falls, such as a reduced external processing bill or contractor hours that the business will no longer purchase. Confirm that the reduction is achievable under existing commitments. A prepaid annual contract does not create immediate cash savings merely because usage declines.
Capacity benefits occur when existing people can use recovered time for other work. Give that time a separate value only when there is a credible use for it. Someone’s fragmented five-minute gaps may not translate directly into additional billable hours. Record the expected use and test whether it occurs.
Revenue benefits depend on additional demand, conversion, delivery capacity, price, and margin. An automation can support additional sales without causing all those sales. Use incremental contribution after relevant costs, not gross revenue, and show the assumption separately from measured cash savings.
Avoid double counting. The same hour cannot both eliminate a contractor payment and become an additional hour of the employee’s revenue-producing capacity. Assign each claimed benefit to an explicit mechanism with evidence and a responsible owner.
Include the complete cost of ownership
Initial costs can include process mapping, content preparation, implementation, testing, training, migration, and release checks. Include internal effort even if nobody sends the business an invoice for it. That effort uses capacity which could have been directed elsewhere.
Recurring costs can include software, hosting, email delivery, storage, monitoring, maintenance, reviews, incident recovery, and customer support. Include failed attempts and corrections rather than modeling only successful cases. First-party software still needs maintenance and dependable infrastructure even when it avoids required customer accounts with outside vendors.
Add a replacement or exit allowance if the workflow would be costly to move. Document ownership of source files, data exports, and recovery instructions. A system with a low subscription charge may have a high practical cost when only one person understands how to repair it.
For AI-assisted work, evaluate changes and uncertainty throughout operation. NIST’s AI Risk Management Framework is a voluntary resource for considering trustworthiness in AI design, use, and evaluation. Referencing it does not certify your workflow; it reinforces the need to budget for evaluation and review rather than assume perfect outputs.
A hypothetical workload and capacity calculation
Consider a hypothetical business handling 600 eligible requests per month. Its observed manual handling time is six minutes per request. Baseline active work is therefore 3,600 minutes, or 60 hours monthly. These numbers are illustrative and should be replaced with your own measurements.
The proposed system leaves three minutes of handling per request, or 30 hours monthly. It also needs four hours of additional review and two hours of internal maintenance each month. Total continuing internal effort is 36 hours, giving a projected recovery of 24 hours compared with the 60-hour baseline.
| Calculation | Hypothetical result |
|---|---|
| Baseline: 600 × 6 minutes ÷ 60 | 60 hours |
| Remaining handling: 600 × 3 minutes ÷ 60 | 30 hours |
| Additional review and internal maintenance | 6 hours |
| Total internal work after automation | 36 hours |
| Recovered internal capacity | 24 hours |
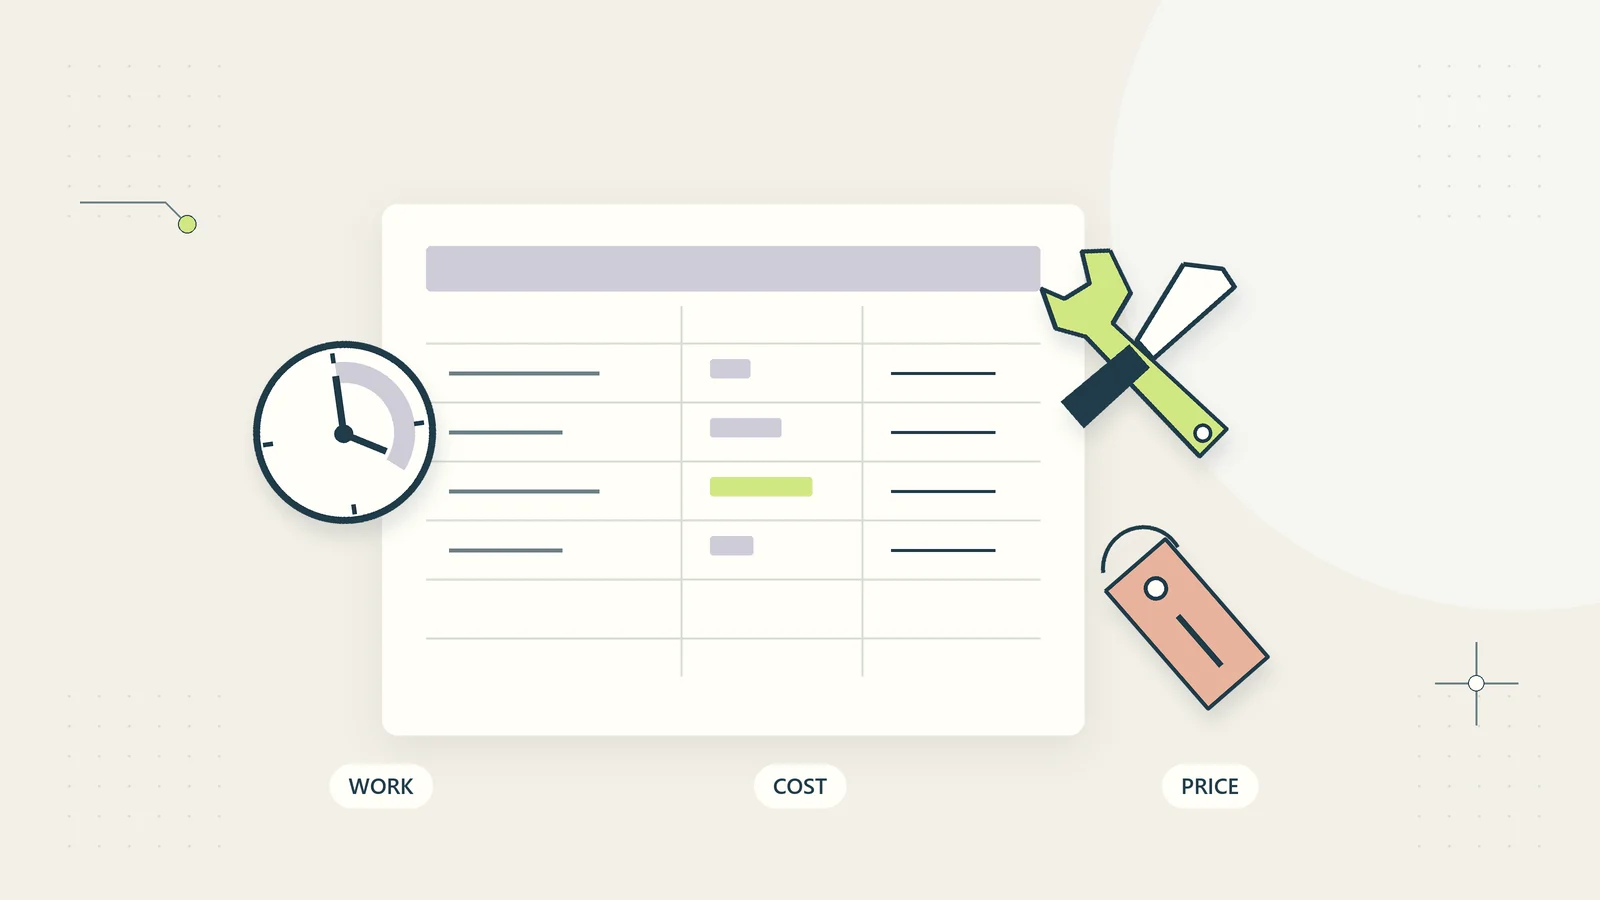
At an illustrative loaded labor value of 35 currency units an hour, those 24 hours represent 840 units of potential capacity value. They do not represent 840 units of cash savings. If only half of the recovered time is usable for other valuable work, the planning value becomes 420 units.
Show both figures and explain why the usable share is credible. A business with no additional work for the recovered time should not present the full capacity value as a near-term financial return.
Calculate cash payback separately
Continue the hypothetical case with recurring cash costs of 120 currency units a month. Suppose this consists of 80 units for operating software and infrastructure and 40 units for external maintenance. The external maintenance charge is separate from the two hours of internal maintenance already counted above.
If no spending is reduced, the direct monthly cash effect is negative 120 units. The business might still choose the project for service reliability or capacity, but there is no positive cash payback from the stated assumptions. Labeling capacity value as cash would conceal that distinction.
Now consider a separate cash scenario in which the business can actually reduce eight purchased contractor hours at 35 units per hour. The verified spending reduction would be 280 units monthly. After 120 units of recurring cash costs, net cash benefit would be 160 units monthly.
With an initial cash implementation cost of 1,800 units, simple cash payback would be 1,800 divided by 160, or 11.25 months. This assumes that the savings and costs stay constant and ignores financing, discounting, and tax effects. If the contractor reduction uses the same recovered work, do not also claim those hours as additional productive capacity.
Your accountant can help determine how the business should evaluate and record the actual investment. This worksheet is an operational comparison, not a financial forecast guaranteed to occur.
Stress-test the assumptions that matter
Keep a low, expected, and high workload case. Do not change every assumption in the favorable direction simultaneously and call the result a forecast. Identify which variables are measured, estimated, or still unknown.
Using the capacity example, a quieter month with 240 requests would start at 24 baseline hours. Remaining handling would consume 12 hours. If review and internal maintenance still require six hours, continuing effort becomes 18 hours, recovering only six hours. Fixed operating work matters much more at low volume.
At 35 units an hour and a 50% usable share, that quieter month has 105 units of capacity planning value. Against 120 units of recurring cash costs, its combined planning value is negative 15 units. That is a mixed economic comparison, not a cash loss calculation, because the 105 units describe capacity rather than received money.
Test higher exception rates and maintenance effort as well. Ask what happens if the system needs twice the planned review, demand falls, or an error temporarily pauses automatic delivery. A proposal that works only under a perfect month deserves a smaller pilot or a simpler design.
Give quality benefits their own evidence
Some benefits are worthwhile but hard to price honestly. Examples include fewer incorrect attachments, clearer customer status, a recoverable delivery route, or reduced dependence on one person’s memory. Record these as outcomes with observable checks rather than assigning arbitrary revenue values.
For each quality outcome, define the failure and the evidence of improvement. “Fewer delivery problems” could become “a smaller share of paid orders needing manual file replacement, measured over comparable periods.” Also check for new failures, such as duplicate delivery or inaccessible download links.
Do not assume the same incident cost for every error. A corrected internal label and an incorrect financial action can have very different consequences. Where serious outcomes are plausible, a process owner needs authority to pause or narrow the system, regardless of whether an average cost worksheet still looks positive.
The AI workflow evaluation guide is useful when the proposed task includes uncertain model outputs. For deterministic delivery, test version selection, authorization, retries, and recovery just as explicitly.
Define a pilot that can disprove the case
Write acceptance criteria before starting. Set a bounded workload, a review period, expected quality, maximum acceptable support effort, and the conditions for stopping. Choose thresholds based on your actual operation rather than copying a generic percentage.
Collect after-change handling time using the same boundary as the baseline. Include time spent checking outputs, answering confused customers, investigating failures, and maintaining the system. Otherwise the pilot measures work moved out of view rather than work removed.
Keep a fallback that the team can perform. If the automation is paused, staff need to know which cases were completed, which are pending, and which require investigation. Repeating every case manually can create duplicate actions if the system already completed some of them.
Review actual capacity use. Did staff complete valuable work with the recovered time, or did the time remain fragmented? Did contractor spending really fall? Did support effort shift to another person? These questions make the business case useful after launch as well as before purchase.
Check the worksheet for accounting errors in the model
Before using the result, trace each benefit back to its source. If reduced handling time already includes fewer corrections, do not add the same correction reduction again as a separate labor saving. If an external maintenance fee includes monitoring, do not invent another avoided monitoring charge unless it is a distinct cost that actually disappears.
Keep periods consistent. An annual setup cost cannot be subtracted directly from one month’s benefit and compared with another project’s annual figure. Show the time horizon, ramp-up period, and any one-time migration or training work. A project that takes several months to reach the expected volume should not receive full-volume benefits from its first day.
Check currencies and the nature of each input. Internal time valued at a loaded hourly rate, contractor invoices, and revenue contribution are different measures. Convert currencies using an explicit dated assumption where necessary, and avoid giving a mixed-value total the label “cash.”
For the hypothetical cash scenario, a full year at 160 units of monthly net cash benefit produces 1,920 units before subtracting the 1,800-unit initial cash cost. The simple first-year net cash gain would therefore be 120 units under those constant assumptions. A lower-volume ramp-up could erase that gain. This extra check makes the apparently attractive 11.25-month payback easier to assess: the margin for error in the first year is small, even though later periods could perform differently.
Build a one-page decision worksheet
Use one row for each important assumption and columns for its value, source, confidence, owner, and review date. Separate measured pilot results from the forecast for a future workload. Keep the calculation readable enough for another person to challenge.
At the top, state the decision: continue the pilot, release a limited version, redesign, or stop. Under it, show initial cost, recurring cash cost, verified cash reduction, recovered capacity, usable capacity assumption, and quality outcomes. This is more informative than a single impressive ROI percentage.
The workflow selection guide can help compare a proposed resource with the actual process boundary. A template is useful when its assumptions fit your operation; buying it does not make every modeled benefit achievable automatically.
Revisit the worksheet after material changes in volume, pricing, model behavior, or staff responsibilities. The best calculation remains a living decision aid: clear enough to reject imaginary savings, practical enough to improve a real business process.
Sources and editorial method
Research checked October 15, 2026. Sources are IBM on business process automation and the NIST AI Risk Management Framework. Source-derived discussion is limited to general process and evaluation context. All numbers, tables, scenarios, and decision methods are original hypothetical examples, not reported customer results or investment advice. Replace every assumption with evidence relevant to your own business.